

The MSP Margin Trap: Why Adding Technicians Kills Your Profitability
MSP profit margin per technician falls as you hire: revenue per tech flattens while loaded cost compounds. Here's the math, and the way out of it.
Every MSP owner has run the same arithmetic at some point: revenue is up, the client list is longer than it has ever been, and yet the money left at the end of the quarter looks roughly the same as it did two years ago. The instinct is to blame pricing, or churn, or one bad client. Usually it is none of those. It is that the business added technicians to grow, and technician cost scales faster than technician revenue.
This post works through why that happens, what the curve actually looks like when you plot it, and what changes when the seats one technician can cover stops being a fixed number. It is written for MSP owners and service delivery leads heading into 2026 budget season, when the hiring plan gets locked and the labor market makes every line on it more expensive than last year's.
Headcount is the only growth lever that costs you before it pays you
Every other growth lever an MSP has is either cheap or self-funding. Raising per-seat price costs nothing but a conversation. Winning a client in an existing vertical costs a proposal. Adding a service line costs a certification. Headcount is the exception: it lands the full cost on the P&L in month one and delivers the revenue somewhere in month six.
That timing gap is the whole trap. A technician you hire in September is a fully loaded cost in September, an underutilized cost through the winter, and a productive asset around the time you are already planning the next hire. Meanwhile the client load that justified the hire has not arrived yet, because you hired ahead of it. You had to. Nobody signs a 400-seat client and then starts recruiting.
The three costs that scale faster than the revenue
Ramp lag. A technician takes three to six months to reach full productivity in an MSP environment, because the job is not just IT skill, it is knowing forty client environments, their quirks, their escalation paths, and which of their users need handling. Full salary, partial output, for a third of the first year.
Utilization decay. MSPs hire on a capacity trigger, usually somewhere around 80% of a technician's practical ticket load. That means every hire temporarily drops the team's average utilization, and the average never fully recovers before the next hire drops it again. The bigger the team, the more of the year is spent in that trough.
Coordination overhead. This is the one that never shows up on a budget line. Each added technician takes a slice of every existing technician's day: handoffs, escalation chatter, standups, shift coverage, someone senior reviewing someone junior's change. Fifteen minutes a day per technician across a ten-person team is two and a half hours daily, which is a quarter of a technician you are paying for and not deploying.
None of these are management failures. They are structural properties of scaling a labor-delivered service. You cannot organize your way out of them, which is why the curve looks the way it does.
What the curve actually looks like
Here is the shape. Revenue per added technician flattens as utilization drops and handoffs multiply. Fully loaded cost per technician keeps compounding through salary inflation, tooling, and ramp. The gap between the two lines, which is your margin, narrows as headcount grows.
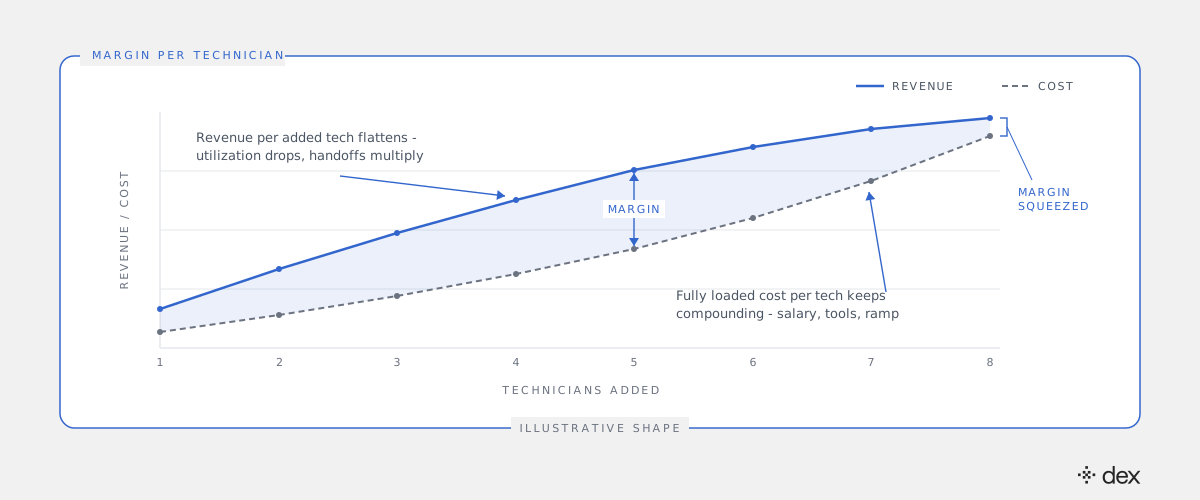
Put numbers against it. Use your own; the structure is what transfers.
Assume $130 per seat per month, a practical capacity of 250 seats per technician, and a fully loaded technician cost of $95,000 per year including payroll taxes, benefits, tooling, and training.
At five technicians, running around 90% effective utilization:
5 techs  x  250 seats  x  0.90        =  1,125 seats
1,125 seats  x  $130  x  12 months    =  $1,755,000  revenue
5 techs  x  $95,000                   =    $475,000  delivery labor
                                         ──────────
                                         $1,280,000  contribution
                                           $256,000  per technician
At ten technicians, with utilization settled around 78% once ramp lag and coordination overhead are absorbed:
10 techs  x  250 seats  x  0.78       =  1,950 seats
1,950 seats  x  $130  x  12 months    =  $3,042,000  revenue
10 techs  x  $95,000                  =    $950,000  delivery labor
                                         ──────────
                                         $2,092,000  contribution
                                           $209,200  per technician
Headcount doubled. Revenue grew 73%. Margin per technician fell 18%, from $256,000 to $209,200. The business is meaningfully bigger and measurably less profitable per unit of the thing it actually sells.
That is the margin trap, and it is why so many MSPs stall between roughly $2M and $5M in managed services revenue. The next client is always worth winning in isolation. The headcount required to serve the next twenty clients is what erodes the business.
Why 2026 makes the trap tighter
Two things changed the arithmetic this year, and both push in the same direction.
The first is labor. Experienced Microsoft 365 technicians have not gotten cheaper or easier to find, and the loaded cost per head has kept climbing while per-seat pricing has stayed under competitive pressure. When cost per technician rises faster than price per seat, the margin gap narrows without anyone making a bad decision.
The second is expectation. Clients have watched autonomous systems arrive in every other vendor relationship they have, and they are no longer willing to pay a premium for a four-hour response on a password lockout. The commodity end of the service catalogue is being repriced downward by the market, and that end is exactly where most technician hours go.
So the hiring plan you are building for 2026 is being drafted into a market where the cost side is inflating and the revenue side of routine work is deflating. Adding technicians to that is adding weight to the wrong end.
The variable that actually moves margin: seats per technician
Look back at the model. Three inputs drive it: price per seat, cost per technician, and seats per technician. The first is capped by competition. The second is capped by the labor market. Only the third is genuinely yours to move, and it is the one most MSPs treat as a constant.
Seats per technician is a constant only if a human has to touch every request. Break that assumption and the whole curve inverts. We laid out the operating detail in how MSPs scale IT support without hiring: when routine and mid-complexity work resolves before it becomes a ticket, one technician can cover two to three times the seats.
Run the same model at 2.5x capacity, holding the team at five technicians:
5 techs  x  625 seats  x  0.90        =  2,812 seats
2,812 seats  x  $130  x  12 months    =  $4,386,720  revenue
5 techs  x  $95,000                   =    $475,000  delivery labor
                                         ──────────
                                         $3,911,720  contribution
Net out the platform cost, which is a per-seat consumption line rather than a payroll line, and the difference is still not incremental. The five-person team now supports more seats than the ten-person team did, at half the labor cost, with none of the ramp lag or coordination overhead that made the ten-person version worse than the five-person version in the first place.
The point is not that software is cheaper than people. The point is that capacity you buy per seat scales with revenue, and capacity you buy per head scales ahead of it.
Where an autonomous engineer sits in an MSP stack
Worth being precise about what is being automated here, because the category is noisy and most of what gets pitched to MSPs as automation is a chatbot with a knowledge base behind it.
Dex is an autonomous IT engineer for Microsoft 365. It investigates the client environment, plans the change, and executes it under explicit policy, with a full audit trail. It resolves L1 through L3: password and MFA work at the routine end, and deeper troubleshooting, configuration, and engineering-adjacent tasks across Entra ID, Exchange Online, SharePoint, and Intune that previously needed a senior technician. Genuine architectural and judgment calls escalate to a human with the full investigation attached, so nobody restarts from zero.
For multi-tenant delivery, Dex Pro runs per tenant on the admin's own delegated permissions rather than a shared API key, with per-org isolated databases and encryption keys and a separate policy set for every client. Every action has to match an explicit policy. No policy, no action. And it sits alongside your PSA rather than displacing it: the ticket that never gets created still shows up in the record as resolved work.
Cliff DuPuy, Director of IT at Grand Traverse County, an MSP running Dex, put the effect in revenue terms rather than cost terms: Dex helped us unlock $67,000 in value in a single day. That was not a savings figure. It was work the team finally had room to do.
What to do with this Monday
Three concrete moves, in order.
Calculate margin per technician for the last three years. Revenue minus fully loaded delivery labor, divided by average technician headcount, per year. If that number is trending down while revenue trends up, you are growing on headcount, and the trap is already priced into your plan.
Find your real seats-per-technician number. Not the target, the actual. Total seats under management divided by delivery heads. That single figure sets the ceiling on every growth model you will build for next year.
Test the ceiling before you test the hiring plan. The next hire is a $95,000 experiment with a six-month feedback loop. Raising seats per technician is a faster experiment with a reversible outcome. Run that one first, and if it moves the number, the hire you were about to make becomes the hire you get to defer.
Growth that requires proportional headcount is not leverage. It is the same business, repeated more times, at slightly worse margin each time.
Frequently asked
- What is MSP profit margin per technician?
- Margin per technician is the gross profit your service delivery generates divided by the number of technicians delivering it: (managed services revenue - fully loaded delivery labor cost) / technicians. It is the cleanest single measure of whether an MSP is scaling or just getting bigger. Most MSPs track revenue per technician instead, which hides the problem, because revenue per tech can hold steady while loaded cost per tech climbs and margin quietly compresses.
- Why does adding technicians reduce MSP profit margin?
- Because cost lands before revenue does, and it lands in full. A new technician carries a fully loaded cost from day one but takes three to six months to reach full productivity, and you have to hire ahead of the client load rather than after it. On top of that, every added technician takes a slice of every existing technician's day in handoffs, escalations, shift coverage, and supervision. Revenue per head flattens while cost per head compounds, so margin per technician falls even as total revenue rises.
- How do I calculate margin per technician for my MSP?
- Take twelve months of managed services revenue, subtract the fully loaded cost of your delivery staff (salary, payroll taxes, benefits, tooling, training, recruiting amortized over tenure), and divide by the average technician headcount over that period. Then plot the same figure for the prior two years. The trend line matters more than the absolute number: if total revenue is up and margin per technician is down, growth is being funded by headcount rather than by leverage.
- Does Dex only handle Tier 1 tickets like password resets?
- No. Dex autonomously resolves L1 through L3, not just L1. That covers routine Tier 1 work such as password resets, MFA recovery, group and license access, and provisioning, and it also covers deeper Tier 2 and Tier 3 troubleshooting and configuration across Microsoft 365, Entra ID, Exchange Online, and Intune that used to require a senior technician. Only genuine architectural or judgment cases escalate to a human, and they escalate with full context attached.
- Does raising seats per technician mean cutting technicians?
- It does not have to, and in most MSPs it should not. The usual outcome is that the next hire gets deferred rather than an existing technician being let go, because the constraint that was forcing the hire disappears. Existing technicians move off the routine queue and onto the work that actually carries margin: project delivery, security posture, client QBRs, and onboarding new tenants faster than the competition can quote them.
- Does agentic IT replace an MSP's PSA or ITSM platform?
- No. Dex works alongside your PSA and ITSM rather than replacing them. It removes requests before they reach the queue and uses your existing system of record for whatever remains, so time entries, SLA reporting, and client billing keep running through the tools you already use. The PSA tracks and routes the work; the autonomous engineer does the work.