

The password reset is the wrong metric: why L1 deflection rate hides your real IT backlog
IT ticket deflection rate counts L1 tickets, not hours. The metric that exposes the L2/L3 investigation backlog your dashboard marks as resolved.
Every IT dashboard leads with the same number: IT ticket deflection rate, the share of requests that closed without a technician touching them. It's easy to measure, it trends up fast, and it's almost entirely made of password resets. That's the problem. Deflection rate counts tickets, and tickets are not the unit your team runs out of. Hours are. The requests that actually drain your senior engineers (the L2 and L3 investigations, the issue that comes back every Tuesday, the escalation that sits for three days) barely move the deflection number at all. This post makes the case that deflection rate is a vanity metric for most IT teams, shows what it hides, and introduces the measure that exposes the real backlog.
Deflection rate measures the cheapest work you have
Deflection rate is a count-based metric, and count-based metrics reward volume, not difficulty.
L1 work dominates ticket volume in almost every Microsoft 365 environment: password resets, MFA recovery, group access, license assignments. It's also the fastest work to resolve. A technician clears a routine password reset in minutes. So when a tool absorbs that slice, deflection rate jumps, the dashboard turns green, and the team's week looks almost exactly the same.
Take a representative queue of 1,000 tickets a month:
  Tier    Tickets   Avg. handling   Engineer hours
  L1        700       10 min            117 h
  L2        250        1 h              250 h
  L3         50        4 h              200 h
                                       ──────
                                        567 h
L1 is 70% of the tickets and about 21% of the hours. Deflect 90% of L1 and you report a 63% deflection rate. Your engineers get back roughly 105 hours out of 567. That's real, and it's worth having. It is also less than a fifth of the workload, presented as nearly two thirds.
That gap between the count and the hours is where the backlog hides. We worked through the dollar side of the same tier split in the IT helpdesk math: L2 and L3 contacts cost several times what an L1 contact does, so the gap is even wider in money than in hours.
What a "resolved" count leaves out
A deflection dashboard shows one column. The work that bleeds hours lives in the other.
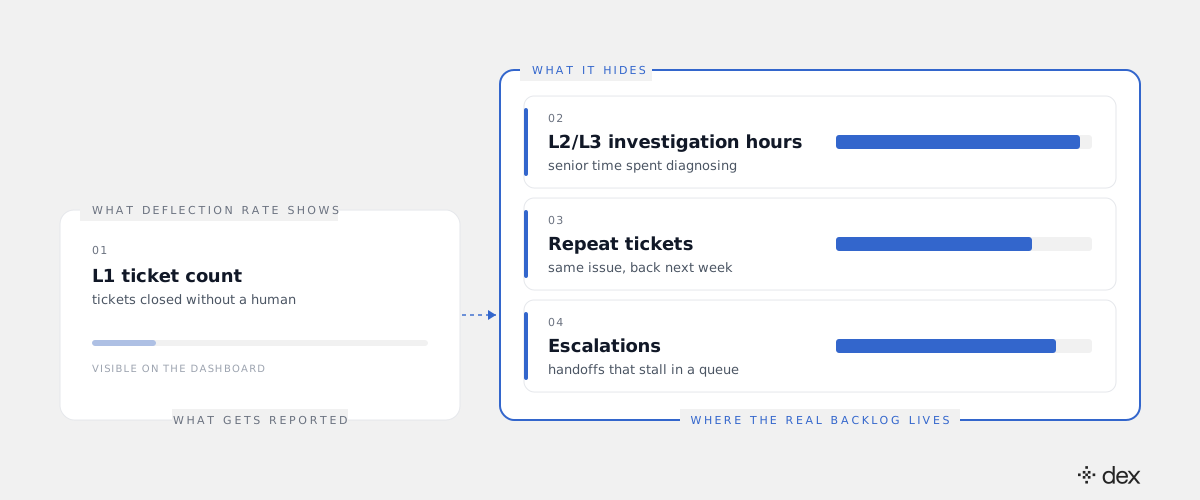
L2 and L3 investigation hours
The expensive part of a hard ticket is not the fix. It's the diagnosis. A mailbox that stopped receiving external mail after a transport rule change. A Conditional Access policy colliding with an Intune compliance state. A dynamic group in Entra ID whose membership rule quietly stopped matching. Each takes an engineer an afternoon of reading logs before a single change is made. None of it shows up in deflection rate, because none of it was ever going to be deflected by a tool that only handles L1.
Repeat tickets
A ticket closed as "resolved" can be the same problem returning next week. If the lockout comes back because a stale credential is cached on a phone, or the sync failure recurs because nobody fixed the root cause, the deflection tool can close it every single time and log every one as a win. The count goes up. The underlying issue never gets touched.
Escalations that stall
When a front-end tool can't resolve something, it hands off. Often the handoff is a forwarded complaint: the original message, no investigation, no hypotheses ruled out. The engineer who picks it up starts from zero, and the request waits in a queue while it does. We covered what that waiting costs in the cost of "we'll get to it". A deflection rate doesn't register any of it, because from the dashboard's point of view the ticket already left L1.
The metric that exposes the real backlog
The fix is to measure hours, not tickets. We call it hours-weighted resolution rate: the share of total engineering hours, across L1, L2, and L3, that resolved end to end without a human doing the work.
Hours-weighted resolution rate  =
    engineer hours resolved end to end (all tiers)
    ÷  baseline engineer hours (all tiers)
Run the earlier queue through it. A tool that deflects 90% of L1 and nothing else scores about 18%, not 63%. A system that resolves deep into L2 and L3 scores higher, because it's taking the hours, not just the tickets. Same queue, same month, very different story.
Two companion numbers keep it honest:
- 30-day repeat rate. The share of resolved requests where the same issue returns for the same user or system within 30 days. A high repeat rate means something is closing tickets without fixing causes.
- Escalation dwell time. How long handed-off work waits before a human picks it up, and how much re-diagnosis happens when they do. A short dwell time with full context means the handoff was a finished investigation, not a forwarded message.
None of this requires new tooling to start. Your ITSM already holds the baseline: tier, volume, and handling time for months of closed tickets. Export three to six months, weight volume by hours per tier, and you have the denominator. For the numerator, the work resolved before a ticket existed, you need the resolver's activity log, because your ITSM never saw it. We laid out that methodology in The Ticket That Never Existed: how to measure deflection you can't see in your ITSM. This metric builds on it: same evidence, weighted by the hours it actually saved.
Why the hours column is where Dex works
Hours-weighted resolution is a hard metric to game, which is exactly why we'd rather be measured on it. A system that only handles password resets tops out around a fifth of the workload no matter how good it is. To move the number you have to resolve the work in the right-hand column.
That's the work Dex was built for. Dex is the world's first autonomous IT engineer for Microsoft 365, and it resolves L1 through L3, not just the front of the queue. Every request runs the same loop: investigate, plan, execute.
- Investigate. Dex finds the root cause across Entra ID, Exchange Online, Intune, and SharePoint, working through up to 40 reasoning steps on a single task instead of stopping at the first error. That's the afternoon of log-reading, done before anyone opens a ticket.
- Plan. Dex decides the sequence of concrete changes, against named targets, and checks every action against an explicit policy enforced in code. No policy, no action.
- Execute. Dex makes the change and records what it investigated, which policy authorized it, and what it did. Persistent memory means the environment quirk it found this week informs the fix next week, so a recurring issue gets treated as a root cause instead of another reset.
When a request genuinely needs architectural or business judgment, Dex hands it to a human with the investigation attached: what it checked, what it ruled out, and why it stopped. That's what shortens escalation dwell time. We drew that boundary in detail in when Dex hands off at the L3 line. For the full loop in plain language, see how Dex works.
Dex's resolution rate is 90%+ end to end across the L1 through L3 surface. Measured by hours, that's the difference between a quieter queue and a team that gets its week back.
What to do Monday morning
Three moves will tell you whether your current deflection number is hiding a backlog:
- Re-weight last quarter by hours. Pull three months of tickets by tier and handling time. Compare the share of tickets that were L1 against the share of hours. If the two numbers are far apart, your deflection rate is overstating your progress.
- Find your top five repeat issues. Sort resolved tickets by user and category over 30 days. Every recurring item is a root cause nobody investigated. That list is your real L2 backlog.
- Ask every vendor for hours, not counts. When a tool quotes a deflection rate, ask what share of your engineering hours it resolves end to end, and ask to see the evidence in your own tenant logs. Keep your ITSM as the system of record for what still escalates; it's the right home for the work that genuinely needs a human.
Deflection rate tells you how many tickets you avoided. It says nothing about how many hours you got back. The password reset was never the problem. The investigation behind the "resolved" count is.
Frequently asked
- What is IT ticket deflection rate?
- IT ticket deflection rate is the share of inbound IT requests that close without a human technician working them, usually through self-service, automation, or a conversational front end. It is calculated on ticket count. That is its weakness: a password reset and a three-day mail-flow investigation each count as one ticket, so the rate says nothing about how much engineering time was actually recovered.
- Why is deflection rate a misleading IT metric?
- Because the tickets that are easiest to deflect are also the cheapest to resolve. L1 requests dominate ticket volume but take minutes each, while L2 and L3 investigations are a smaller share of volume and consume most of the engineering hours. A tool can post a high deflection rate by absorbing L1 work while the expensive backlog, repeat tickets, and stalled escalations stay exactly where they were.
- What should IT leaders measure instead of deflection rate?
- Measure hours-weighted resolution rate: the share of total engineering hours, across L1, L2, and L3, that resolved end to end without a human doing the work. Pair it with a 30-day repeat rate (the same issue returning for the same user or system) and escalation dwell time (how long handed-off work waits before a human picks it up). Together those three numbers show where the backlog actually lives.
- Does Dex only deflect L1 tickets like password resets?
- No. Dex resolves L1 through L3 autonomously. Password resets and MFA recovery are the most visible work because they are the highest volume, but Dex also investigates, plans, and executes the Tier 2 and Tier 3 work that used to sit with senior technicians: multi-step troubleshooting across Entra ID, Exchange Online, Intune, and SharePoint, plus configuration and engineering-adjacent tasks. Only genuine architectural or judgment calls escalate, with full context attached.
- How do I calculate hours-weighted resolution rate from my ITSM data?
- Export three to six months of closed tickets with tier and time-to-resolve or logged effort. Multiply volume by average handling hours per tier to get your baseline hours. After deployment, sum the handling hours of requests resolved end to end without a human, using the resolver's activity log as the source of truth, and divide by baseline hours. Your ITSM stays the system of record for everything that still escalates.