

The cost of "we'll get to it": what unresolved IT tickets actually cost while they sit in the queue
IT ticket cost is usually measured at close. Here is the queue-cost model: what a ticket accrues per day while it waits, as CFO-ready TCO math.
Every IT ticket cost model in circulation answers the same question: what does it cost to close this ticket? Twenty-two dollars. Twenty-five. Seventy if it is a password reset that needs an outbound callback to verify the user. Those are real numbers, carefully researched, and they are the wrong ones to plan against. Each describes a single moment, the few minutes when the work actually happens, and says nothing about the eleven days that came before it.
This post is about the other half of the number: what a ticket costs per day while it waits. That cost is not a flat fee. It accrues, and it accrues faster the longer the ticket ages. Written as a rate instead of a lump sum, it gives you something the standard model cannot, which is a defensible price for latency itself. Latency is the only variable an automation investment actually changes, so if you are building a business case, this is the page to forward.
Cost-to-close is a snapshot. Queue cost is a rate.
The standard IT ticket cost figure is a cost-to-close figure. It bundles technician time, ticket-system overhead, and routing, then divides by tickets closed. The arithmetic is sound. The problem is that the result is indifferent to time. A ticket closed twenty minutes after it arrives and the same ticket closed twenty days after it arrives both cost about $25 by this measure, because both consumed the same six minutes of technician attention.
Anyone who has run a service desk knows those two tickets did not cost the same. The second one accumulated something in the gap. That something has never had a line in the model, so it has never had a number, so it has never survived contact with a budget review.
We worked the full loaded cost of a Tier 1 ticket in an earlier post: roughly $25 on the invoice, three to five times that once user wait time, engineer interruption, and escalation overhead are counted. That post gives you the stock, meaning what the function costs at its current speed. This one gives you the rate, meaning what each additional day of waiting adds. They answer different questions and you need both.
What actually accrues while a ticket sits
Three things happen to an unresolved ticket. All three are measurable, and none of them appear in a cost-to-close model.
Context decays. On day one, the user remembers the exact error, the time it happened, and what they were doing. By day twelve they remember being annoyed. The technician who finally opens the ticket cannot work from the original description, so they ask again, and the user reconstructs a version that is thinner than the first one. The investigation that the user already did for free gets redone on the clock.
Workarounds spread. A blocked person does not sit quietly and wait. They borrow a colleague's credential, export the data manually, run the report from a personal device, or ask someone with broader permissions to do it for them. The workaround solves today's problem and becomes a permanent practice, copied across the team, outliving the ticket that caused it. You pay for that one twice: once in the hours it consumes, and once in the governance gap it leaves behind.
One ticket becomes two. An unresolved root cause keeps producing symptoms. The mailbox routing problem that nobody has touched generates a second ticket about a missing calendar invite and a third about an external sender bouncing. They arrive as independent tickets, get independently triaged, and consume independent resolution cost, all from the same cause that was already sitting in the queue.
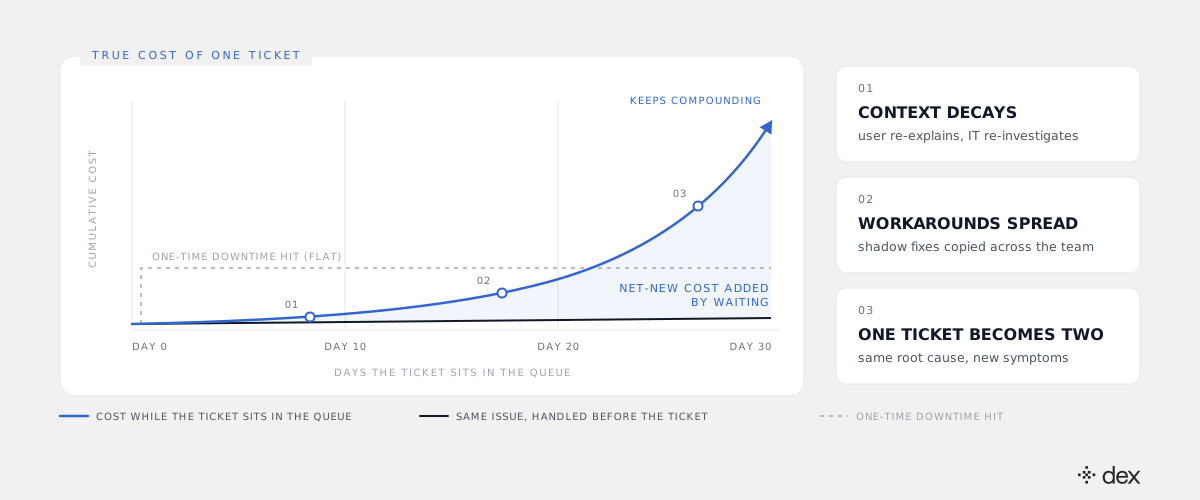
The shape is the argument. The lower line is the same issue handled before a ticket exists: a one-time hit, then flat forever. The upper line is the same issue in a queue, where each of the three mechanisms above keeps adding. This is not the overnight availability gap, which is a different problem we covered in the 3AM ticket problem. This curve bends during business hours, with the team fully staffed, on tickets nobody has forgotten about.
The queue-cost model, in four inputs
Four numbers, all of them available from a ticket export and one call to finance.
Cost to close (K). The loaded cost of the resolution itself. Use $75 for a routine ticket if you have nothing better, which is the $25 invoice figure at the conservative end of the 3x loaded multiplier.
Daily carry rate (R). What one day of waiting costs. Build it rather than assert it. A partially blocked knowledge worker loses roughly 20 minutes a day to the workaround, which at a loaded $50 per hour is $16.67. Status-chasing traffic in both directions, amortized across the week, adds about $5. That is a carry rate near $22 per day, and it is deliberately conservative, since it assumes the user is working around the problem rather than stopped by it.
Days in queue (D). Pull this from your own data as a median and a tail, never as an average. Averages hide the cohort that does the damage.
Branch factor (B). The share of aged tickets that generate a second ticket from the same root cause. Count it once from a sample of 50 aged tickets. Most desks land between 0.3 and 0.5.
True cost of one ticket  =  K  +  (R × D)  +  (B × K)

Closed same day:   $75  +  ($22 × 1)   +  (0.4 × $75)  =   $127
Sat for 14 days:   $75  +  ($22 × 14)  +  (0.4 × $75)  =   $413
Identical technician effort. Identical entry in your cost-per-ticket report. More than three times the cost to the business.
Running the model on a 500-person queue
Take the same organization from the Tier 1 math: 500 employees, about 2,000 tickets a year. Split the queue by how long things actually sit.
Fast cohort   1,700 tickets × 1 day  × $22   =   $37,400
Aged cohort     300 tickets × 14 days × $22  =   $92,400
Branching       300 tickets × 0.4 × $75      =    $9,000
                                                ─────────
Annual queue cost                               $138,800
Fifteen percent of the tickets carry two thirds of the queue cost. And the total is in the same range as the entire operational cost of running the service desk for that organization. The sitting costs about as much as the closing, and only one of those two numbers has a line item.
Do not double-count the multiplier
One discipline point, because getting this wrong will cost you the room. Do not add the $138,800 to the loaded-cost figure from the Tier 1 post and present the sum as your spend.
The loaded-cost multiplier is a stock. It already describes what the function costs at current resolution speed, wait time included. The queue-cost model is a rate. It isolates the time variable so you can model what happens when the wait changes. Use the multiplier to size today's spend, and use the carry rate to size the delta from any intervention you are proposing. A CFO who catches a double count stops evaluating the rest of the analysis.
The queue ages exactly the tickets you can least afford to age
Here is the uncomfortable part. Queue discipline actively selects for aging the expensive tickets.
SLA dashboards reward closure counts and first-response times, which makes the rational move for a busy technician to clear the fast, obvious, low-carry tickets first. The ones that get deferred are the ones that need a named engineer, a change window, or somebody else's approval. Those are also the ones with the highest carry rate, because they block real work rather than a login.
So the carry accrues disproportionately on L2 and L3 cases, which is precisely why a tool that only clears the simple end of the queue barely moves this number. Deflecting password resets makes the dashboard look better and leaves the expensive cohort untouched.
The only input that collapses the curve
Look at the formula and ask which variable you can actually move.
K is close to fixed, set by salaries. B is a consequence of D. Adding technicians reduces D linearly at best, and does it by adding a large, permanent cost to reduce a variable one. That is the trade every service desk has already made as far as it can afford to.
D is the term with the leverage, and the only way to take it to zero is to remove the wait rather than staff it. That is the structural claim behind agentic IT: a request that is investigated, planned, executed against the real system under policy, and closed on arrival never enters a queue, so it never accrues carry. Dex resolves L1 through L3 autonomously, which is what makes this apply to the aged cohort and not just the easy one, at a target of 90%+ end-to-end resolution. End-to-end is the qualifier that matters here. A request routed to a knowledge-base article is still sitting in the queue, it is just sitting somewhere your dashboard cannot see.
For admin-side work, the console where that happens is Dex Pro, which executes across Microsoft 365, Google Workspace, Okta, and any SaaS with an API, under a policy engine enforced at the code level with a full audit trail. Cases genuinely requiring human judgment still escalate, with the investigation already attached, so D for the residual queue drops too.
What to put in front of the CFO
Three things, on one page.
-
The carry rate, built up from components. Not a benchmark you cited. Twenty minutes of degraded output plus status overhead, at your own loaded rate. A number the CFO can audit is worth more than a number from a research firm.
-
Your own aged cohort, isolated. Export 90 days, sort by days-open, take the top 15%, and multiply. This is a fifteen-minute analysis and it is almost always the strongest slide in the deck, because it is your data describing your queue.
-
The delta, not the total. Do not argue that IT is expensive. Argue that latency is expensive, show the carry rate times the days you would remove, and let the total stay where it is.
"We'll get to it" has always sounded like a scheduling decision. It is a purchasing decision, made in small daily installments, by whoever is not tracking the bill.
Frequently asked
- What does an unresolved IT ticket cost while it sits in the queue?
- Separately from the cost to close it. The standard IT ticket cost benchmark of $20 to $30 measures technician time at the moment of resolution and is indifferent to how long the ticket waited. The waiting has its own price, made of degraded user productivity while the person works around the problem, status-chasing traffic in both directions, and re-investigation when a technician finally picks up a ticket whose context has gone stale. Built up from those components, a realistic daily carry rate for a routine business-hours ticket lands around $20 to $25 per day. A ticket that sits two weeks therefore costs several times more than the same ticket closed on the day it arrived, even though both consumed identical technician time.
- How do you calculate IT ticket cost for a CFO business case?
- Use four inputs rather than one. First, cost to close, the loaded cost of the resolution itself. Second, the daily carry rate, what one day of waiting costs in lost user output and status overhead. Third, days in queue, taken from your own ticket export as a median and a tail, not an average. Fourth, a branch factor, the share of aged tickets that spawn a second ticket from the same root cause. True cost of one ticket equals cost to close, plus carry rate times days in queue, plus branch factor times cost to close. Every input is available from a 90-day ticket export and a loaded hourly rate from finance, which is what makes the model defensible in a budget review.
- Does this double-count the 3x to 5x loaded-cost multiplier?
- It does if you add the two models together, so do not. The loaded-cost multiplier is a stock figure: it describes what the IT function costs today at today's resolution speed, with wait time already baked into the multiplier. The queue-cost model is a rate: it isolates the time variable so you can see what changes when the wait goes to zero. Use the multiplier to size the current spend, and use the carry rate to model the delta from any intervention. Presenting the carry number as additional spend on top of the loaded cost is the fastest way to lose a CFO's confidence in the rest of the case.
- Why do aged tickets cost more than the same ticket resolved on day one?
- Because three costs compound rather than sit still. Context decays, so the user re-explains and the technician re-investigates work that was already done once. Workarounds spread, because a blocked person does not wait quietly, and the shared credential or manual export they improvise gets copied by colleagues and outlives the ticket. And one ticket becomes two, because an unresolved root cause keeps generating new symptoms that arrive as new tickets with no link back to the original. None of these appear in a cost-to-close model, and all of them scale with the number of days the ticket is open.
- Does Dex only resolve Tier 1 tickets?
- No. Dex autonomously resolves L1 through L3: routine Tier 1 work such as password resets, MFA recovery, access and license requests, and also the deeper Tier 2 and Tier 3 troubleshooting, configuration, and engineering-adjacent work that used to require a senior technician. That range is what matters for queue cost specifically, because the tickets that sit longest are rarely the simple ones. They are the L2 and L3 cases that need a named engineer who is already booked. Only genuine architectural or business-judgment calls escalate to a human, and they arrive with the full investigation attached.