

The number that survives the CFO: building the per-resolution TCO case for autonomous IT
IT ticket cost per resolution, built for the CFO: a fill-in TCO model for labor, downtime, escalation and tooling, and how it changes the buying decision.
IT ticket cost per resolution is the fully loaded cost of taking one IT issue from unresolved to resolved: the technician time, the hours the user spent blocked, the escalation handoffs, and the slice of tooling the fix consumed. Most organizations have never written that number down. They have a cost-per-ticket benchmark, a helpdesk headcount line, and a stack of tool invoices, and none of those three is the unit a finance reviewer is now using to judge software.
That matters because the deal no longer dies at discovery. It dies in the internal cost fight, after approval, when a CFO asks what the organization pays per outcome and nobody in the room can answer in one line. This post is a reusable model for that answer. It uses no vendor pricing. You fill it in with your own figures, and it works for any tool you are evaluating, including ours. If you are the champion, this is the page to forward.
Why cost per resolution is the unit finance now uses
Finance has moved its review to the end of the buying process. We covered the numbers behind that shift in why CFOs veto software purchases that were already approved: nearly half of B2B buyers saw an approved purchase vetoed in the prior year, and AI spend was the most exposed category. The veto is rarely about price. It is about a number that cannot be forecast or compared.
Outcome pricing changed what "compared" means. As more vendors bill per resolution, buyers have started measuring every tool against that unit, including tools that are not priced that way. A seat-based quote now gets the question: what does that come to per issue actually fixed? If the champion cannot convert the quote, the reviewer does it for them, usually with worse assumptions.
So the goal is not a bigger savings number. It is one comparable unit, built from inputs finance already trusts, that holds for today's helpdesk and for every alternative on the table.
The four layers inside one resolution
Every resolution carries four kinds of cost, whether or not anyone tracks them.
Labor. Technician time on the issue, including the parts that do not look like work: triage, clarifying questions, follow-up, and the reopen when the first fix did not hold. This is the only layer the standard cost-per-ticket benchmark captures well.
Downtime. The user's lost output from the moment they report the issue to the moment it is fixed. A blocked employee is paid the whole time. In the cost of "we'll get to it" we built this into a daily carry rate and showed how it compounds while a ticket ages in the queue. Here it enters the model as one term per resolution.
Escalation. The cost of work changing hands. Each handoff from L1 to L2 to L3 adds a re-read, a re-investigation, and often a second conversation with the user. Escalation is where cost per resolution quietly doubles.
Tooling. The helpdesk platform, the automation add-ons, the integration glue, and the admin time to keep them running, spread across the resolutions they supported that year.
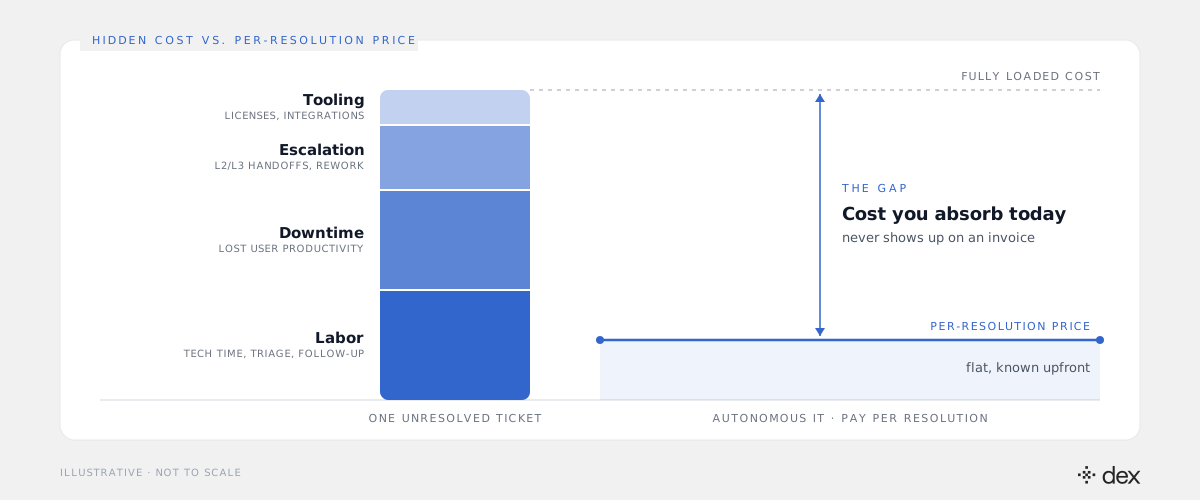
Only two of these layers show up on an invoice, and only one of them lands in IT's budget. Downtime sits in every other department's P&L, and escalation is buried inside labor as senior engineer hours. That is why the per-ticket figure looks modest and the real figure does not.
The per-resolution TCO model
Here is the model. Every letter is a number you already have or can pull in an afternoon.
TODAY: cost of one resolution on your current path

  L  = technician minutes per resolution   x  loaded tech rate per minute
       (triage + work + follow-up + reopens)
  W  = user minutes blocked, report to fix x  loaded employee rate per minute
  E  = escalation rate                      x  cost per handoff
       (re-read + re-investigation + second user contact)
  T  = annual tooling cost on the path     /  annual resolutions

  Cost per resolution today   =  L + W + E + T

PROPOSED: blended cost per resolution with the new tool

  N  = annual resolutions (same volume as today)
  r  = verified end-to-end resolution rate
  A  = annual cost of the tool, all layers included
  O  = annual oversight time for the people who operate it

  Blended cost  =  [ A  +  O  +  (1 - r) x N x (L + W + E + T) ]  /  N
Three rules keep the model honest.
- Use resolutions as the denominator, never tickets. A ticket opened and deflected to an article is not a resolution. If the denominator is inflated, every other number in the model is flattering and the CFO will find it.
- Count downtime once. If you already present a loaded-cost multiplier for the helpdesk, do not add W on top of it. Use one or the other, and say which.
- Let W move with the tool. The largest change an autonomous system makes is not to L. It is to the minutes between report and fix. An issue resolved in the conversation where it was reported carries almost no W, which is why this term, not labor, often decides the result.
Converting any pricing model to cost per resolution
The model works because every pricing structure reduces to A, the annual cost. The conversion is where most business cases go wrong.
Seat-based. A equals the platform fee, plus seats times seat price, plus any metered AI tier at your expected usage. Watch the metered line. It is the one finance cannot forecast, and it is usually where the automation you are actually buying lives.
Per-resolution or outcome-based. A equals price times resolutions. It looks like the model does itself, but check two things. First, the vendor's definition of a resolution: if it counts containment, your r is lower than their invoice implies. Second, the shape: cost rises with volume, so a successful rollout produces a bigger bill, and the annual number is not known until the year ends.
Flat per operator. A is a fixed line sized to the few people who run the tool, and cost per resolution falls as volume rises. This is how Dex is priced: per technician who operates it, with the employees Dex helps never needing a license and resolutions never metered. We are not arguing it is the cheapest shape at every volume. We are arguing it is the one where A is known on day one, which is the property the reviewer is pricing.
Whichever shape you evaluate, run all of them through the same blended formula. Comparing a seat price to a per-resolution price directly is comparing two different units, and the CFO will notice.
How per-resolution economics change the buying decision
Once every option is expressed per resolution, three things shift in the room.
The question moves from "what does it cost" to "what does it cost per outcome." A higher annual line can win if r is high enough, and a cheap tool with a low verified resolution rate loses, because (1 - r) x N x today's cost stays in the numerator.
Scope becomes the dominant variable. The expensive layers, escalation and downtime, concentrate in L2 and L3 work, the tickets that wait for a named engineer. Dex autonomously resolves L1 through L3: password resets, MFA recovery and access provisioning, plus the Tier 2 and Tier 3 troubleshooting, configuration and engineering-adjacent work that used to need a senior technician. A tool limited to L1 can post a strong r on the cheapest resolutions and barely move the blended number. When you fill in r, fill it in per tier.
Verification becomes part of the price. A per-resolution case is only as strong as its resolution count. Every Dex action is written to native Microsoft 365 logs and to Dex's own Activity Log, so finance can audit N against the line it is paying. For admin-side work, those actions run in Dex Pro on the admin's own delegated permissions, under a policy engine enforced in code, which answers the risk question before it is asked.
The stress tests a CFO will run
Before the model is forwarded, run the three checks a finance reviewer will run anyway.
- Halve r. If the case only works at the vendor's quoted resolution rate, it is not a case. Show the blended number at half the claimed rate and let it stand.
- Double the volume. Under outcome pricing, A doubles. Under a flat line, cost per resolution halves. Show both, because this is the scenario a growing organization actually faces.
- Zero out W. Present the case with labor, escalation and tooling only. If it still clears, downtime becomes upside instead of a load-bearing assumption the reviewer can discount.
A model that survives all three is a model the champion can defend without being in the room.
What to forward
One page. The four layers with your own inputs. Today's cost per resolution. The blended number for each option, including doing nothing. The three stress tests. No transformation slide, no productivity narrative, no vendor benchmarks you cannot source.
The cost per resolution is the number that survives the CFO because it is the only one they can check. Build it from your own data, run every option through the same formula, and the internal cost fight becomes a comparison instead of an argument.
Frequently asked
- What is IT ticket cost per resolution?
- It is the fully loaded cost of taking one IT issue from unresolved to resolved, divided across four layers: technician labor, user downtime while the issue is open, escalation overhead when the work changes hands, and the share of tooling cost the resolution path consumes. It differs from the usual cost-per-ticket figure in two ways. The denominator is issues actually closed end to end, not tickets opened or deflected, and the numerator includes the time the user spent blocked, not just the minutes a technician spent working. It is the only unit that lets you compare a human helpdesk, a seat-based tool, and an autonomous system on the same line.
- How do I calculate cost per resolution for a CFO business case?
- Use four inputs per resolution. Labor is technician minutes, including triage, follow-up and reopens, times the loaded technician rate. Downtime is user minutes blocked from report to fix, times the loaded employee rate, counted once. Escalation is the share of issues that change hands, times the cost of each handoff and re-investigation. Tooling is the annual cost of the tools on the resolution path divided by annual resolutions. Add the four for today's number. For the proposed tool, add its annual cost and the oversight time it needs to the cost of the issues it will not resolve, then divide by total resolutions. Every input comes from a ticket export, a tooling invoice, and one loaded hourly rate from finance.
- Is per-resolution pricing better than seat-based pricing?
- Not automatically. Per-resolution pricing makes the unit visible, which is why buyers now measure seat-based tools against it, but it moves volume risk to the buyer: the more the tool resolves, the larger the bill, and the definition of a resolution is set by the vendor. Seat-based pricing is fixed per head but charges for capacity whether or not work gets resolved. A flat line sized to the small team that operates the tool gives a known annual cost and an effective cost per resolution that falls as volume rises. Whichever model you evaluate, convert it to cost per end-to-end resolution before comparing.
- Does Dex only resolve L1 tickets?
- No. Dex autonomously resolves L1 through L3: routine Tier 1 work such as password resets, MFA recovery and access provisioning, plus the deeper Tier 2 and Tier 3 troubleshooting, configuration and engineering-adjacent work that used to require a senior technician. Only genuine architectural or judgment calls escalate to a human, with the full investigation attached. Scope matters to the per-resolution model because the expensive layers, escalation and downtime, concentrate in L2 and L3 work, so an L1-only tool leaves the largest part of the cost untouched.
- What counts as a resolution when comparing vendors?
- An issue investigated, planned, executed against the real backend system under policy, and closed, with the change verifiable in an audit log. A deflection to a knowledge base article is not a resolution, and neither is a request contained by a chatbot that never fixed anything. Ask every vendor for the end-to-end resolution rate specifically, and ask how you can verify the count yourself. Dex writes every action to native Microsoft 365 logs and its own Activity Log, so the denominator in your model can be checked rather than taken on trust.